All I wanted was to see inside an ArrayList — but now you can too!
Table of Contents
I’m learning Zig. I chose a HOCON parser as my intro project. I am writing it from scratch and the parser core is mine, no AI writing it for me, because typing the code myself is the whole point. AI is my mentor: it shows me the proper idioms, helps me prepare tests, and generates auxiliary tools — e.g., Java and Python parsers to check compatibility.
Very soon I realized I was learning a systems language without a debugger. Not having a good debugger is like learning anatomy from a book with the pictures torn out. I don’t want std.debug.print archaeology. I want to put a breakpoint into my parser, run one test, and look at my ArrayList.
That turned out to be a bigger ask than I expected.
The graveyard tour
VSCode first — supposedly the best thing right after neovim; even in the Zig community you’ll find neovim people who switch to VSCode just for debugging (“I use Neovim btw, but not debugging… for that I’m using VSCode”). It works. But I have a decade of PyCharm muscle memory, and VSCode fought me on every keystroke. And the integrated terminal… oh boy. If it can be tuned, please write in the comments that I’m a noob — I’ll take it — but out of the box it is genuinely unpleasant to use — in one word: laaaaaaging!
ZigBrains next, because JetBrains is home for me. Lovely plugin, felt right immediately… but I honestly never managed to get the debugger running at all. Not flaky, not unstable. It simply never started for me.
So half of my parser got written in VSCode anyway, with print statements, while I kept muttering that there must be a better way.
Enter Zed (which I had already written off once)
A year ago I tried Zed for Python and shelved it. Zed is still my ‘wow’ editor — fast, clean, and one setting away from feeling like home:
{
  "base_keymap": "JetBrains",
  "autosave": "on_focus_change",
  "debugger": { "stepping_granularity": "statement" },
  "inlay_hints": { "enabled": true, "show_value_hints": true }
}
Plus a few bindings PyCharm burned into my hands — rerun last test on ctrl-r, rerun last debug session on ctrl-d, toggle comment on cmd-ú (Czech keyboard problems), move line with cmd-shift-arrows:
{
  "context": "Workspace && !Terminal",
  "bindings": {
    "ctrl-r": "task::Rerun",
    "ctrl-d": "debugger::Rerun"
  }
}
That stepping_granularity: "statement" line cost me an hour of confusion: Zed defaults to "line", VSCode uses the DAP default "statement", and this difference alone makes stepping through Zig feel weird in Zed until you flip it.
Click Debug. Nothing happens.
The Zig extension puts a lovely ▷ in the gutter next to every test block, with a Debug option. I clicked it and got:
error: None of the locators for task `zig test --test-no-exec` completed successfully
Turns out debugging Zig tests in Zed was broken for everyone, three bugs stacked on top of each other: the extension mis-parsed its own -femit-bin= argument (a leftover split("=") after strip_prefix that could never succeed), the --test-filter argument kept its literal quotes so zero tests matched the filter, and every debug run leaked a fresh zig_test_<uuid> binary into the project root. Three small fixes later my breakpoint finally hit — the first PR of this story went to zed-extensions/zig#44, followed by #45 (stop leaking test binaries into the project root) and #46 (the pretty printers you’ll meet below).
The vanishing variable
Then it got weird. I’d stop on a breakpoint, press step-over once and my variable appears. Press it again… gone from the Variables panel. I blamed Zed. Then CodeLLDB. Then myself: I renamed the variable and it “started working” (spoiler: it didn’t, the PC offset just moved).
Full disclosure: this is where I stopped guessing and pointed Claude Code at it, and we spent the evening in dwarfdump together. The verdict was beautiful. For any local initialized with try:
const key = try self.parseStringValue();
the Zig compiler emitted the variable inside a DW_TAG_lexical_block whose address ranges covered about 24 bytes, the tail end of that one line. One step later the program counter left the block and the debugger, entirely correctly, considered the variable out of scope. Someone had already hit this and filed ziglang/zig#30705 back in January (a regression from an October refactor in the LLVM backend), and it was sitting there with zero comments. Our dwarfdump session turned into the missing root-cause analysis, and the fix is literally one line restoring a defer that the refactor dropped.
Until it lands in a release near you, the workaround is to split the declaration:
var key: Node = undefined;
key = try self.parseStringValue();  // visible for the whole scope
And now: actually seeing inside the ArrayList
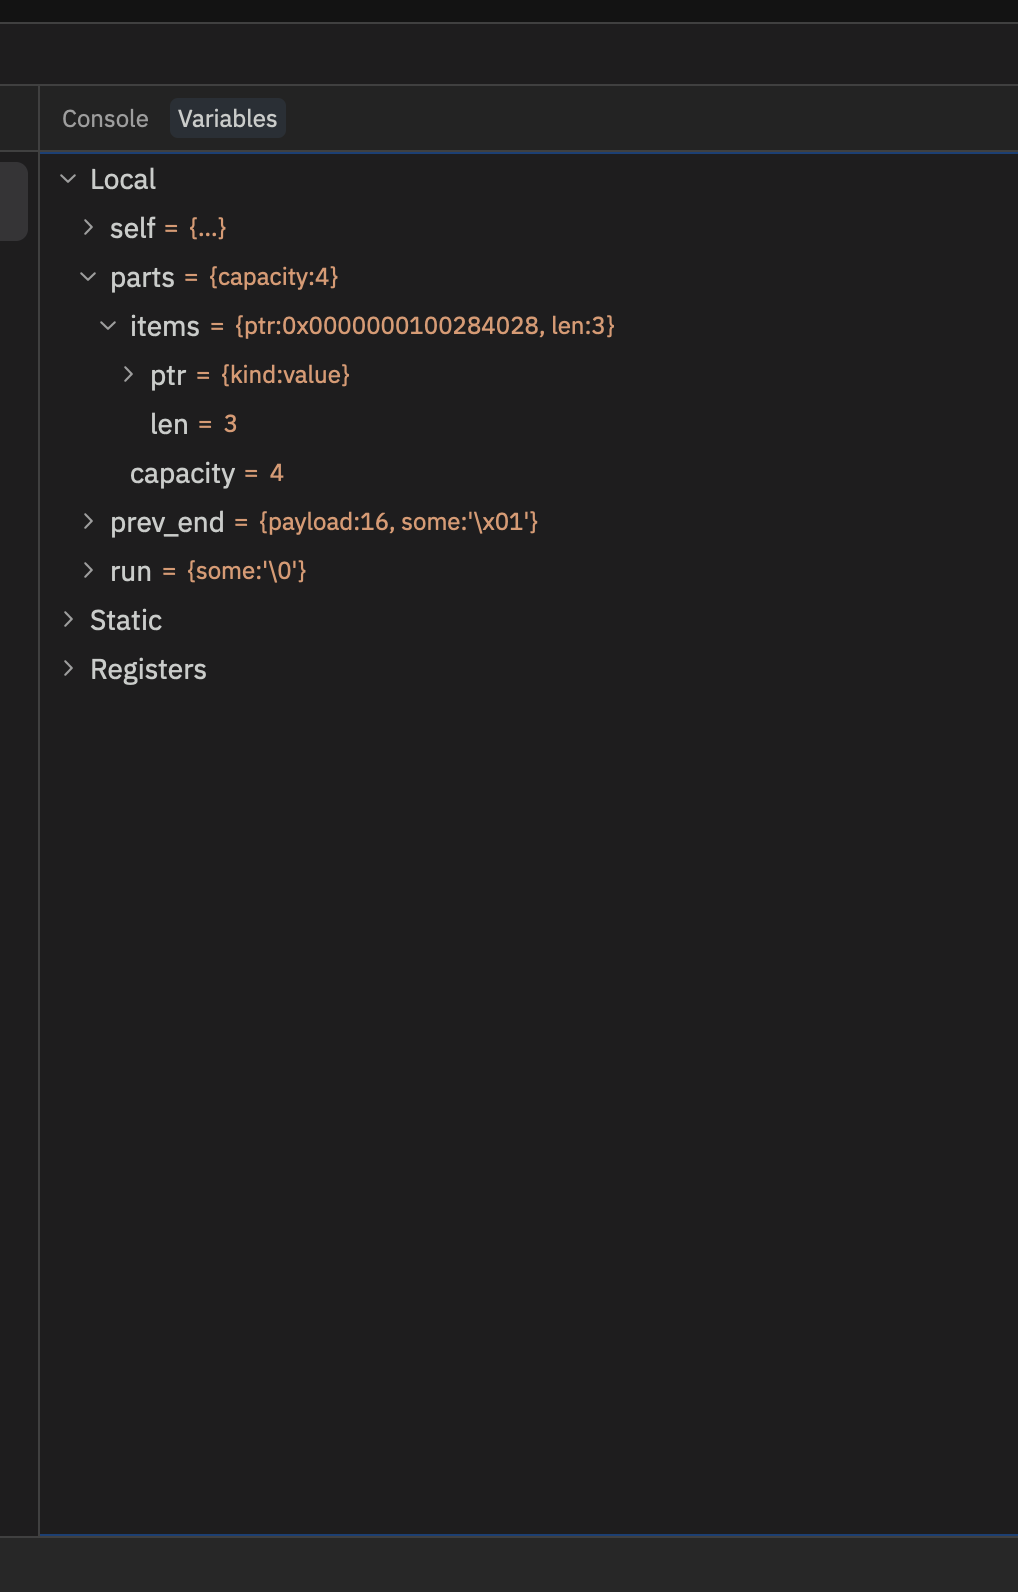
With debugging alive, the Variables panel still showed my std.ArrayList(Node) as ptr / len / capacity. Raw pointers. In 2026, really?
(To be fair, I didn’t have to solve this. I could have kept typing parray 3 parts.items.ptr into the debug console. And yes, I had to look up that incantation every single time, which is exactly the problem.)
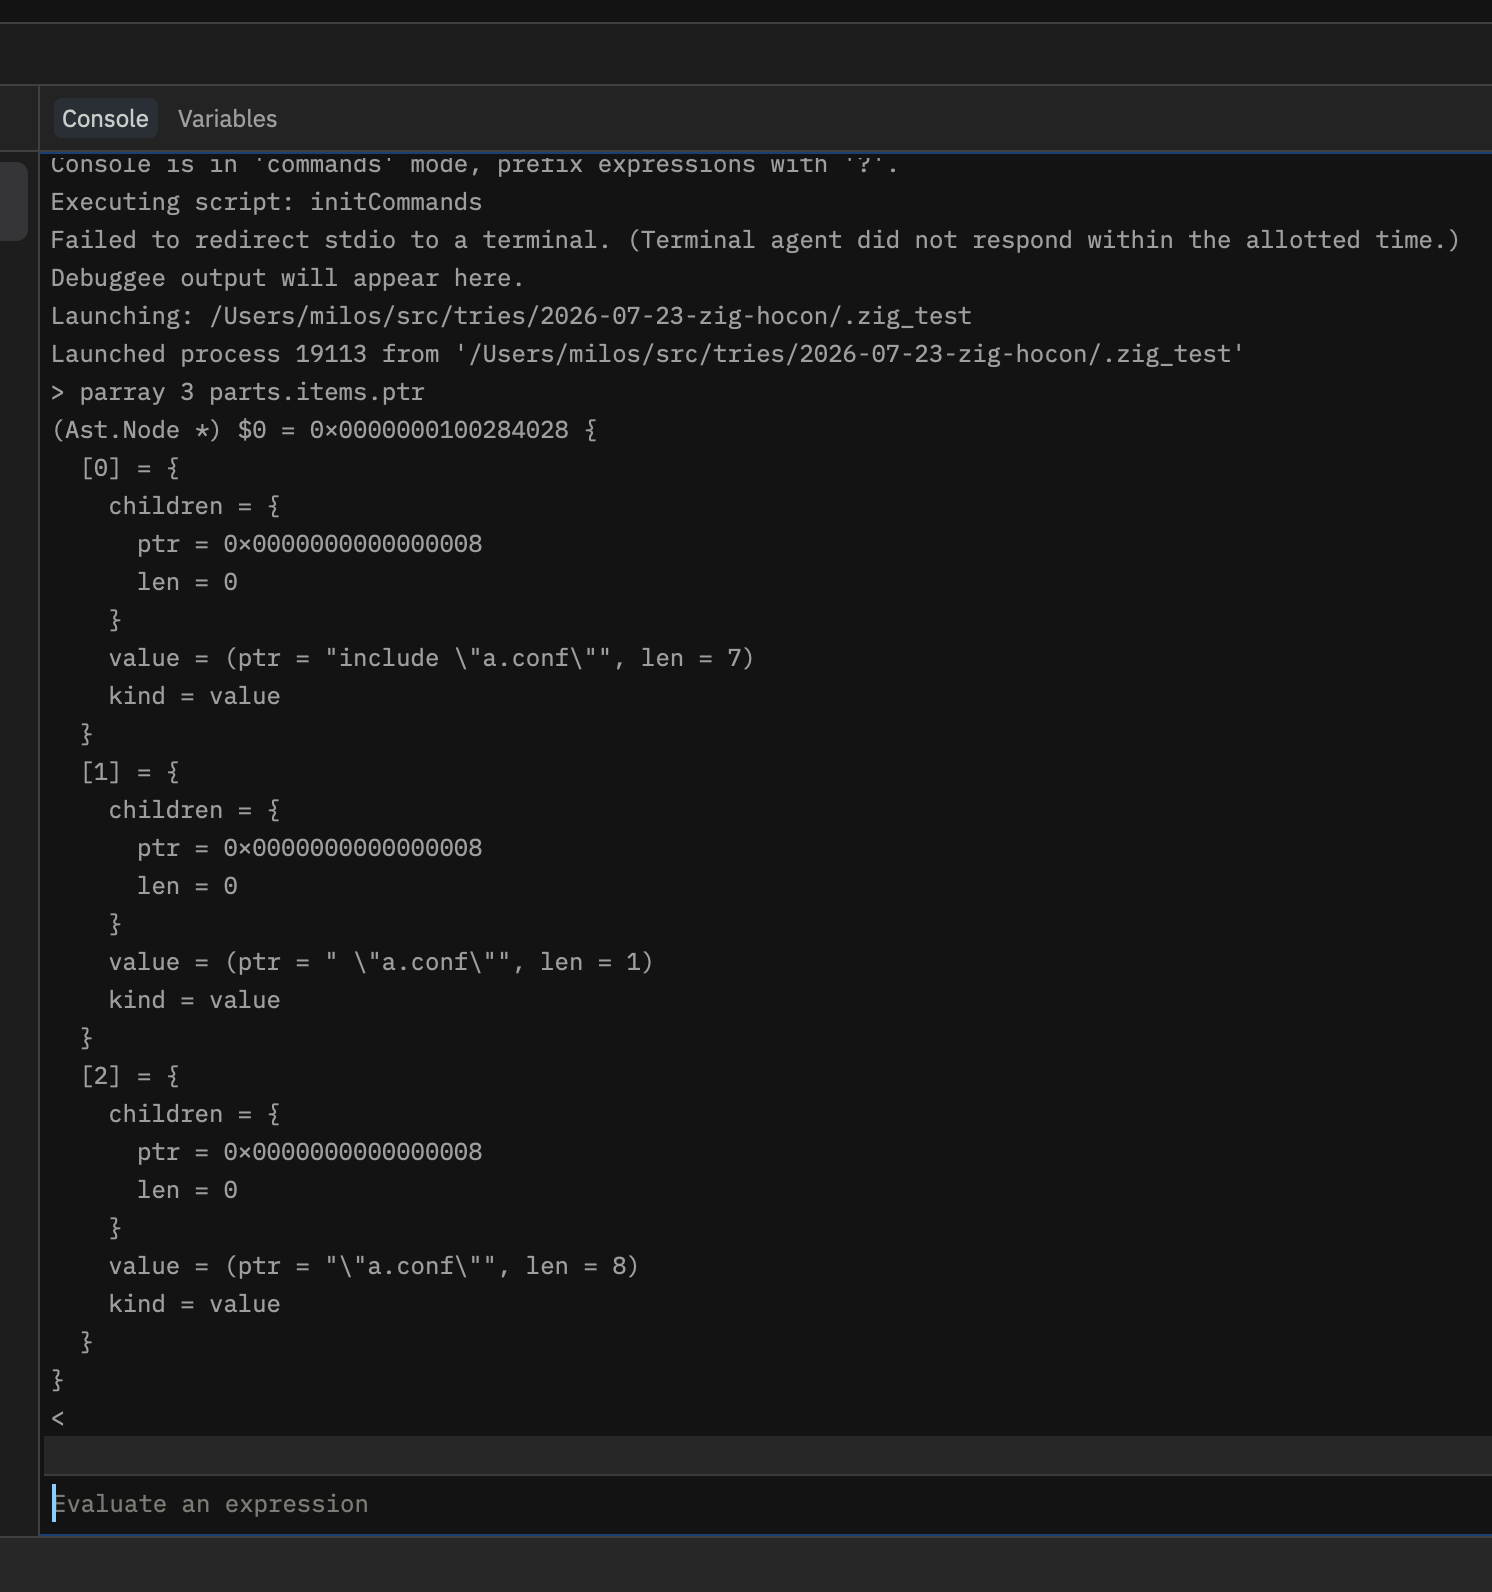
And here is something I should have picked up from the very same Ziggit thread — mnemnion had them wired up back in 2024: Zig ships LLDB pretty printers. Formatters for slices, ArrayList, optionals, error unions, HashMap. In 0.16 they hide in the source tree (tools/lldb_pretty_printers.py); since 0.17 they even come with every zig installation as lib/lldb/pretty_printers.py. Either way, nothing loads them for you. So the extension does it now, via CodeLLDB’s initCommands (wrapped in HandleCommand, because a failing initCommand otherwise kills the whole launch, ask me how I know), plus a small addition of mine that puts the type into the summary, since Zed’s panel doesn’t render the DAP type field:
parts = std.ArrayList(Ast.Node) len=3 capacity=4
  items = []Ast.Node len=3
    [0] = {children:len=0, value:"b", kind:value}
 ➔
➔
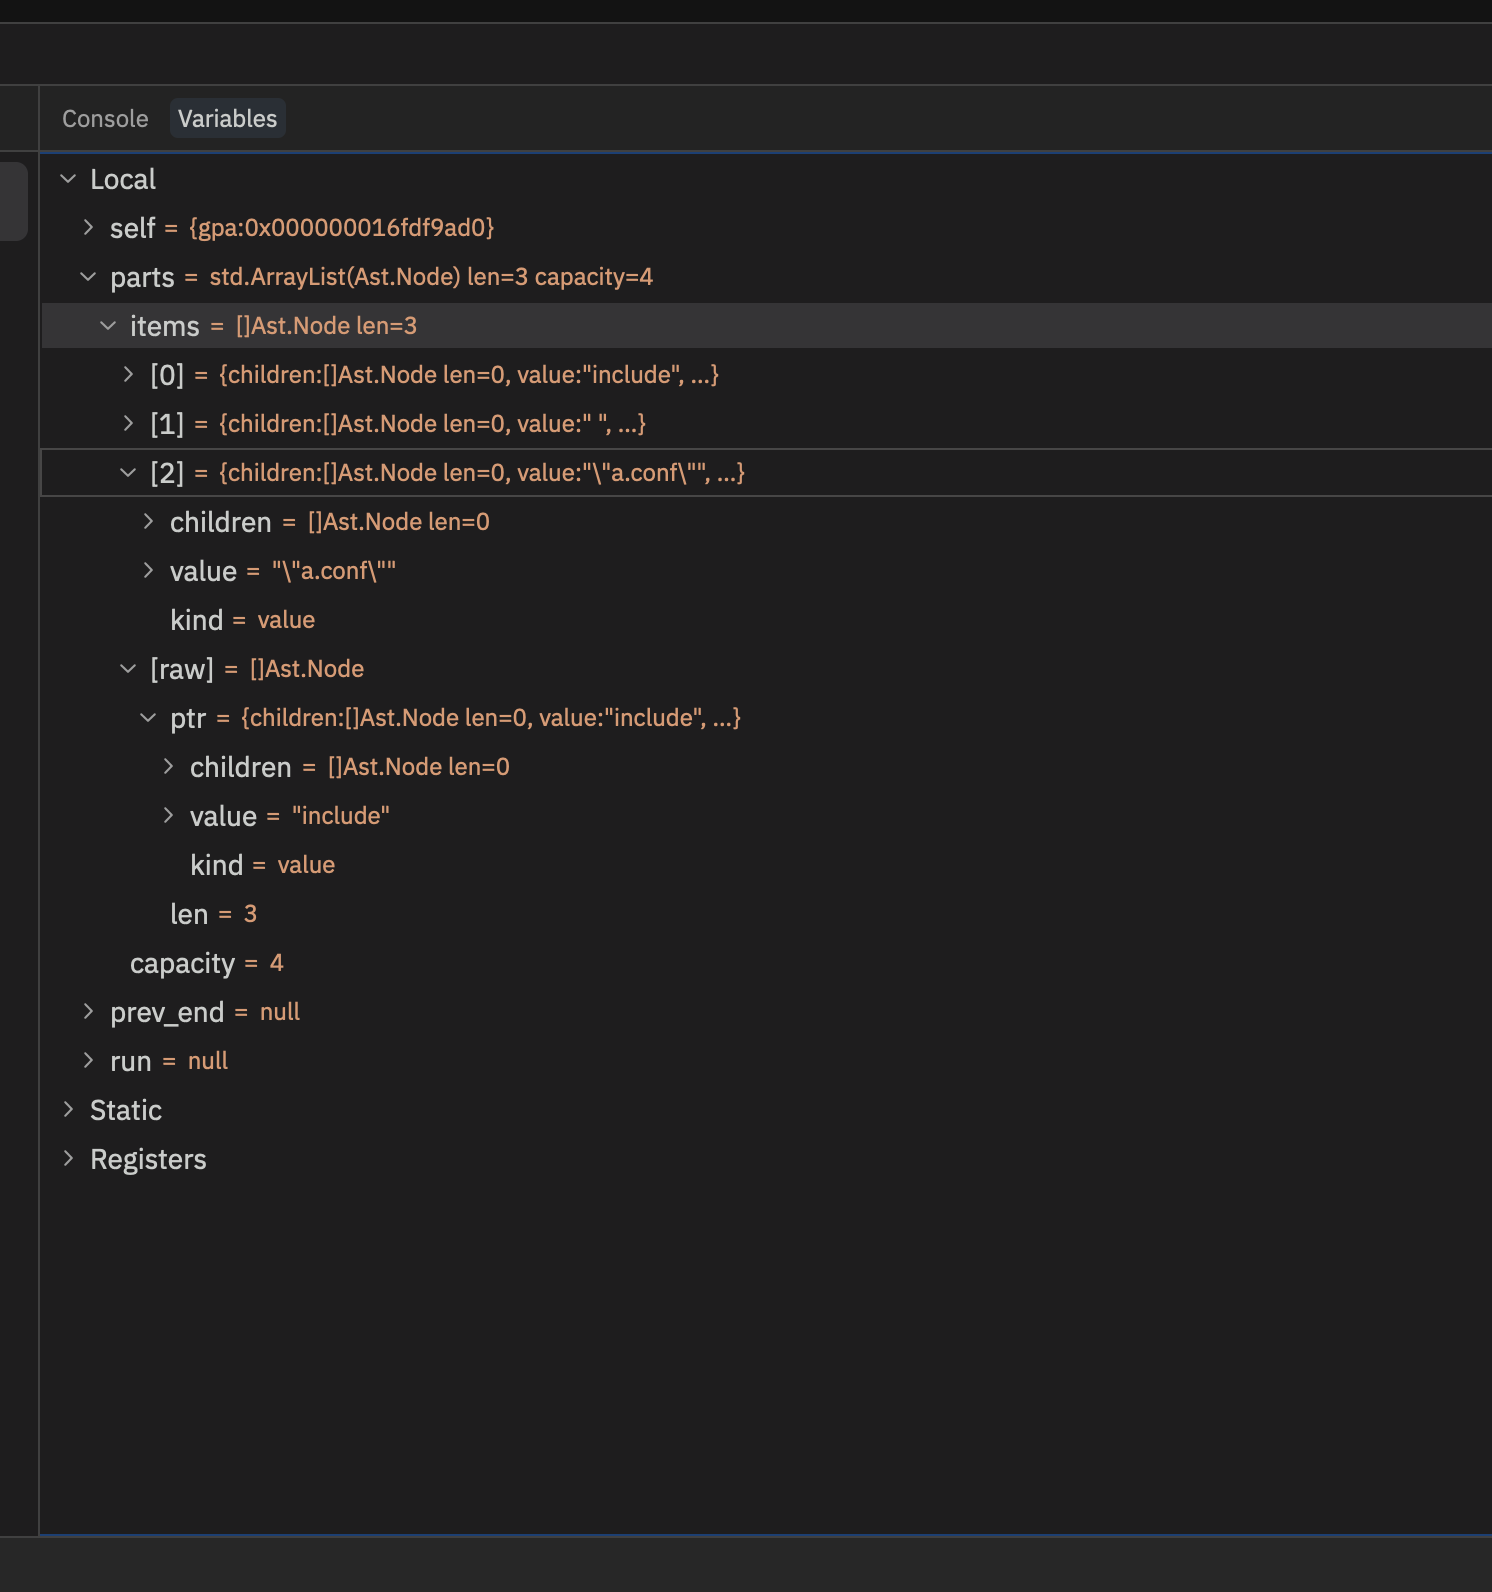
That’s my ArrayList. I can see inside it. Field names and everything.
The payoff
My loop now: ▷ in the gutter runs one test. Breakpoint. ctrl-d reruns the same debug session while I iterate on the parser. Variables readable, stack visible, everything in one place: editor, terminal, debugger, tests.
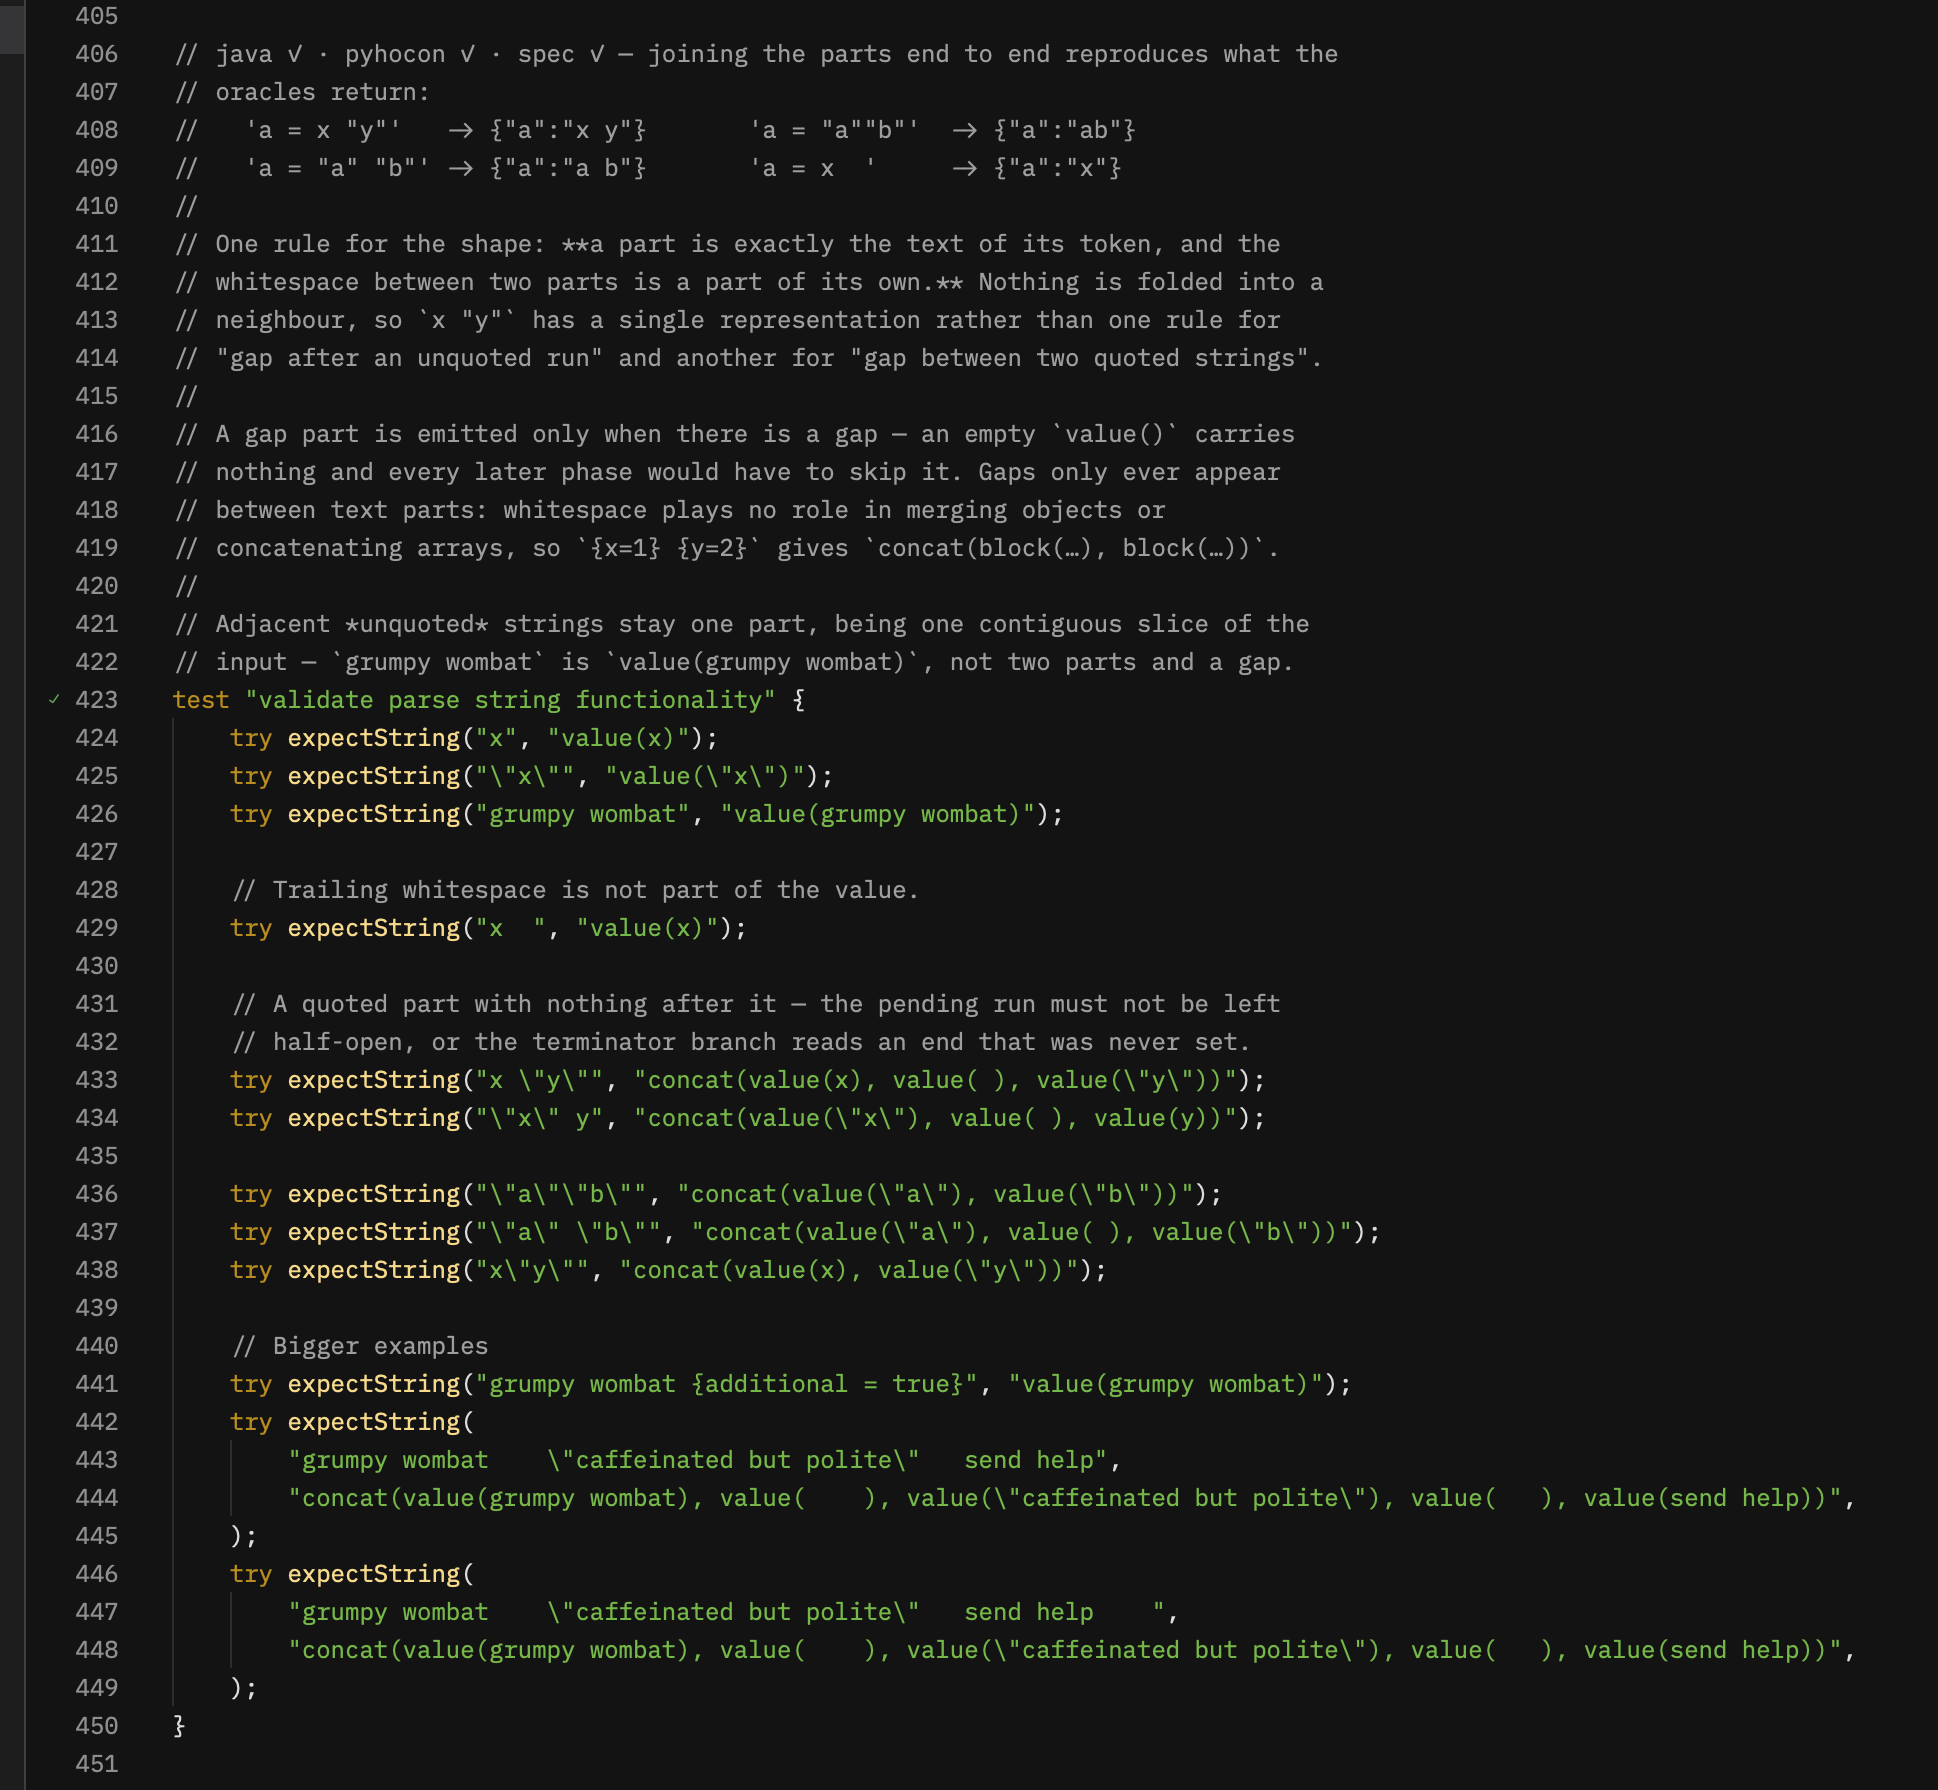
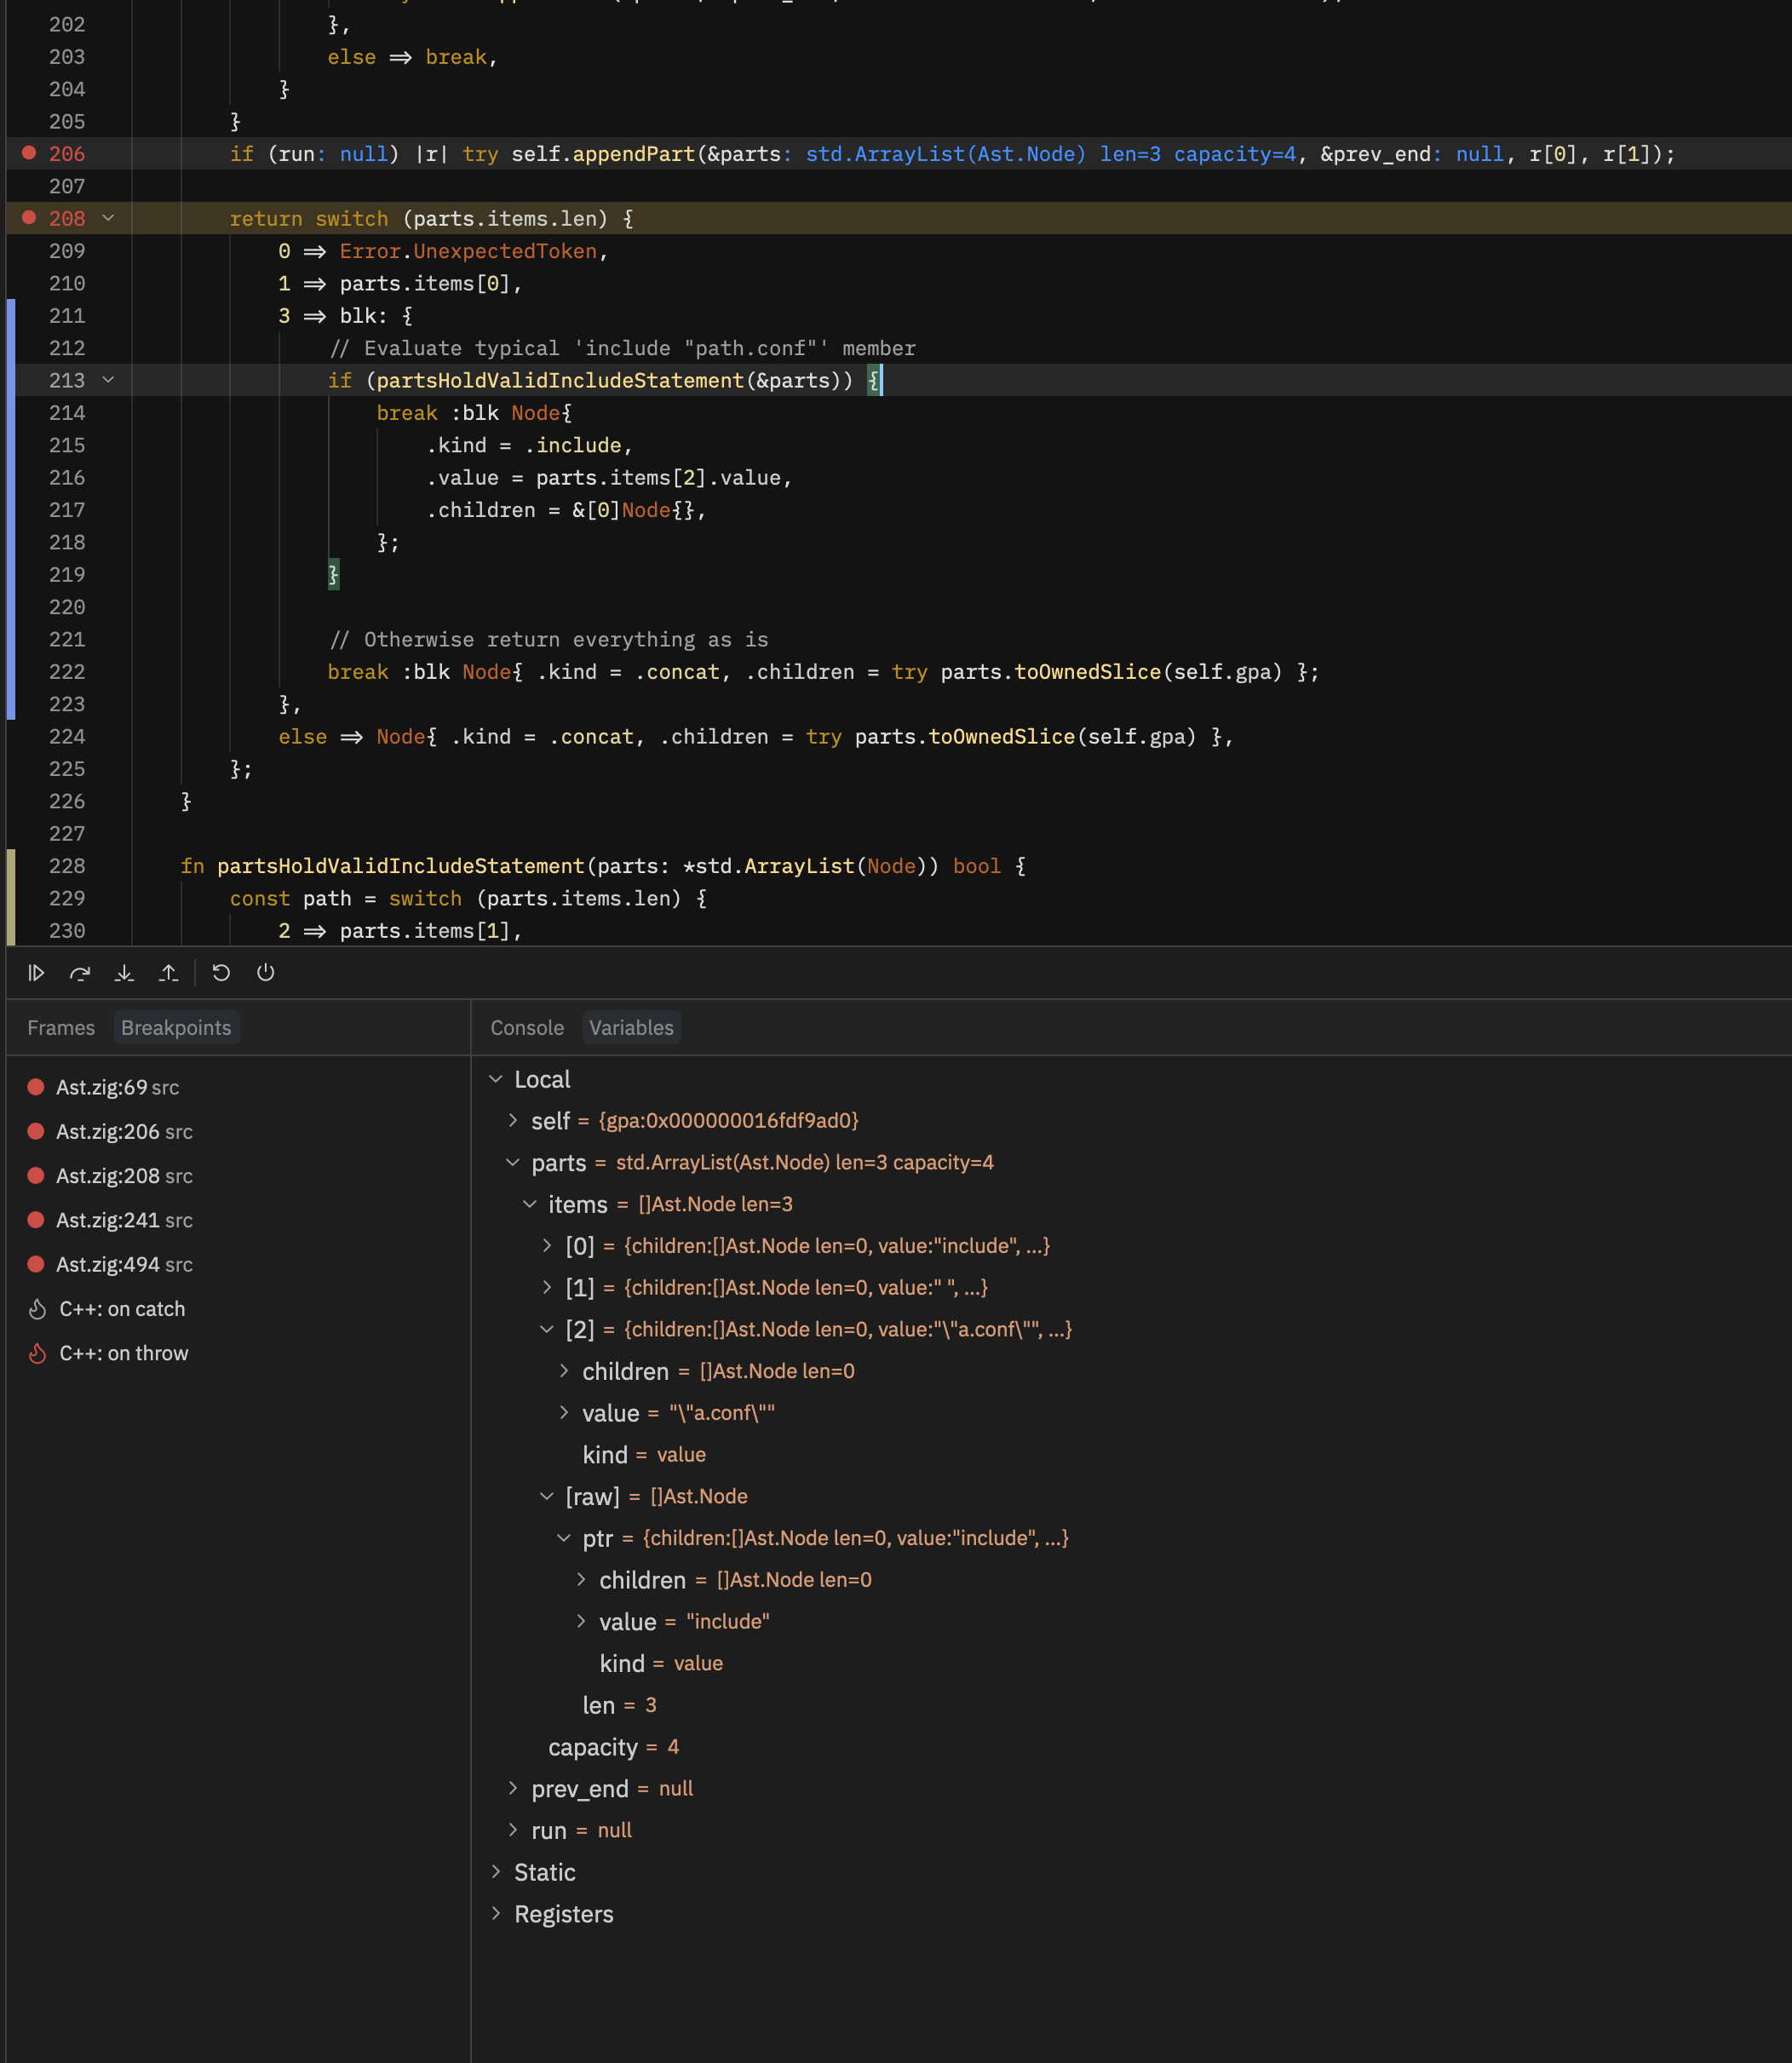
It took one editor, three extension fixes, one compiler patch and a Python script that was sitting in the Zig repo all along. And I love it.
Try it yourself
Until the extension PRs land upstream, all the fixes above are available on one branch of my fork — you can run them today:
- Make sure you have a Rust toolchain via rustup (Zed compiles dev extensions locally),
git clone -b all-fixes https://github.com/lejmr/zed-extensions-zig.git- In Zed:
cmd-shift-x→ Install Dev Extension → pick the cloned folder.
Zed builds it, downloads CodeLLDB on the first debug session, and from then on the gutter ▷ → Debug just works — pretty printers included. Once the PRs land, just uninstall the dev extension and switch back to the official one.